20 years differences between counties. Life expectancy disparities in the US are increasing
A new, population-based analysis, reveals that live expectancy in the US varies dramatically between geographical regions. While life expectancy is still on the raise, the growing gap between the longest and the shortest life spans illustrate the urgent need for policy action to reduce disparities.
Life expectancy is often used as a tool to measure the health performances of states. It is easily comparable across countries and it also offers an indication about the economical development of a state. A recent study published in Jama Internal Medicine looked at data form the 80s to 2014 in order to monitor life spans across the US and the conclusion has made scientists worry. While life expectancy in the US is still on the rise, just like in other developed countries; there are growing gaps between geographical regions. And between the longest and the shortest life expectancy, the disparities registered by specialists are of 20 years.
Analyzing data coming form US counties, scientists observed that in 13 counties, children born today will actually have a lower life span than their parents. And this inequality between counties is growing and has been on the rise since the 1980s.
loading...
Top five counties with the lowest life expectancy
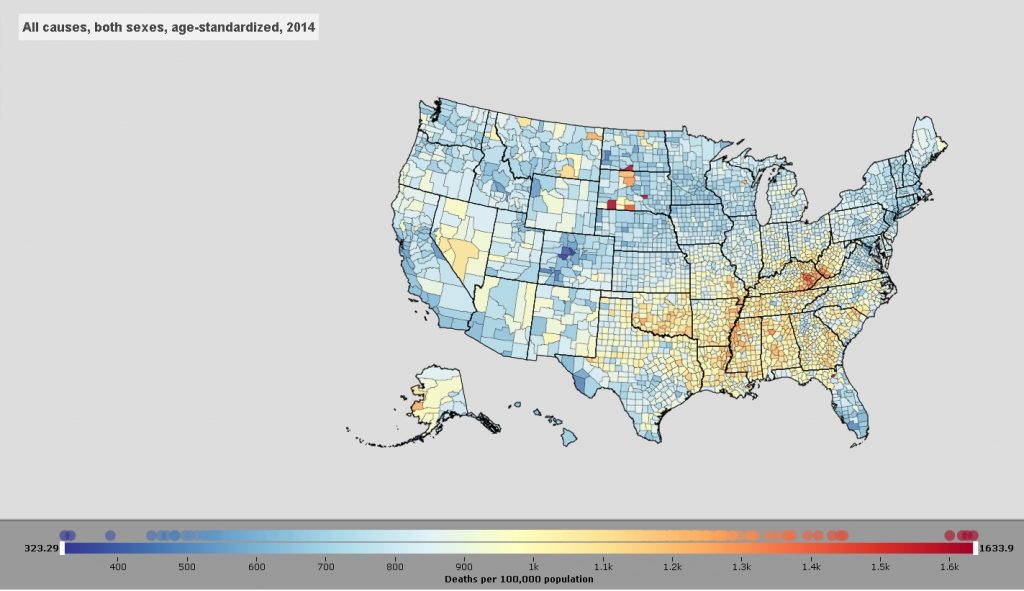
In some counties, life expectancy was similar to that registered in states like India, Iran or Sudan were the average lifespan is set at around 77 years. Some of the lowest life expectancy was registered in South Dakota and North Dakota, in counties with Native American reservations. Among the top five counties with the lowest life spans in America, three are form South Dakota but scientists also noticed that clusters of counties with shorter life spans have also been registered in the South, specifically in states like Kentucky, West Virgina and Mississippi.
1. Oglala Lakota County, South Dakota 66.81 years
2. Union County, Florida 67.57 years
3. Todd County, South Dakota 68.51 years
4. Sioux County, North Dakota 68.59 years
5. Buffalo County, South Dakota 69.05 years
And scientists also point out that South Dakota, North Dakota, together with Mississippi and Alaska, also scored high when it comes to mortality risk. To make a comprehensible study, researchers also examined the risk of dying among five age groups. Oglala was ranked first in the top counties with the highest mortality risk for children aged 0 to 5 years-old and also for adults aged 25-45.
Data shows that 11.5% of counties saw an increased risk of death in adults between 25 and 45. In addition, inequality in the probability of dying has risen for people between 45 and 85 since 1980.
Kusilvak in Alaska scored the highest when it comes to mortality rates for children and young adults aged 5 to 25 and Florida was first when it comes to mortality risks for those aged 45 to 65. Buffalo in South Dakota was ranked first for mortality risks for those aged 65 to 85.
There is also a warning sign when looking at the counties that have registered the highest decrease in life expectancy form the 1980s to 2014. Kentucky seems to have serious problems with its counties occupying eight of the top ten positions with Owsley county registering the decrease of 3%.
Top five counties with the highest life expectancy

Just like there are clusters of low life expectancy, researchers showed that there are also clusters of high life expectancy. Counties in Colorado scored the highest with a lifespan of almost 87 years in Summit, 86,5 in Pitkin County, and almost 86 in Eagle. A county form North Dakota and one form California complete the top states with longest life spans.
loading...
1. Summit County, Colorado 86.83 years
2. Pitkin County, Colorado 86.52 years
3. Eagle County, Colorado 85.94 years
4. Billings County, North Dakota 84.04 years
5. Marin County, California 83.80 years
Also, when looking at mortality risks, researchers show that all counties saw a drop in the risk of dying before age 5, and the gap between the counties with the highest and lowest levels of under-5 mortality narrowed since 1980. This could be caused, experts say, by the introduction of health programs specifically targeting infants. Marin County in California has the lowest mortality risk for babies, followed by Hunterdon County in New Jersey and Loudoun County in Virginia.
When it comes to children and young adults, the lowest levels of mortality were registered in Center County, Pennsylvania. Adults have higher chances of survival in Loudoun and those aged 45 to 65 registered the lowest mortality rates in Summit County witch also scored low rates for those aged 65 to85.
Alaska succeeded in registering the highest increase among all of US counties in life expectancy in places like the Aleutian East Borough and the North Slope Borough; New York County came in third and Sumter in Florida and San Francisco in California fourth and fifth.
Poverty and obesity account for many of the disparities

Analyzing the raw data, researchers wanted to see if there are specific social, economical and health factors that can explain the gaps registered between the counties. Risk factors like obesity, lack of exercise, smoking, hypertension, and diabetes, scientist found that it explained 74% of the variation in longevity.
Experts say that targeted political measures could drive down the differences and health policies that promote a healthier behavior could be the most efficient way to increase life expectancy and close the growing gaps.
Programs that fight against obesity, promote exercise and prohibit smoking could go a long way in improving the overall health levels in counties across the US.
“Looking at life expectancy on a national level masks the massive differences that exist at the local level, especially in a country as diverse as the United States,” explained lead author Laura Dwyer-Lindgren, a researcher at Institute of Health Metrics and Evaluation. “Risk factors like obesity, lack of exercise, high blood pressure, and smoking explain a large portion of the variation in lifespans.”
But the disparities are also linked to economical issues like poverty, income, education and unemployment. Social issues like race and ethnicity also play a crucial role in driving down or up life expectancy. Together, socialeconomic factors were independently related to 60% of the inequality, and access to and quality of health care explained 27%.
Any actions aimed at redressing the current situation should not ignore social status, race and other related factors. Especially as the situation could get even worse in the years to come if this issues are not addressed, experts warn.
“The inequality in health in the United States – a country that spends more on health care than any other – is unacceptable,” said Dr. Christopher Murray, director of IHME. “Every American, regardless of where they live or their background, deserves to live a long and healthy life. If we allow trends to continue as they are, the gap will only widen between counties.
The researchers also point out America’s position in the world when it comes to life span and the amount of money that citizens are paying for healthcare. According to the World Health Organization data, collected back in 2015, Japan is still the number one country when it comes to life expectancy. Japan is followed by Switzerland, Singapore, Australia and Spain. Generally, European countries fair better than the US when it comes to lifespan with America only occupying the 31st position, with lower levels than Chile and Costa Rica and only doing marginally better than Cuba and Qatar.
The same differences are also shown by data collected by the World European Bank.
And when looking at expenses, scientists point out that data from 2014 show that Japan spent just $3,816 per person on healthcare while Australia, also a country among the top five in life expectancy spent just a little over $4,000 per person. In contrasts, the United States spent $9,237 per person on health care in 2014.
Loading...