EU is world’s top exporter of pharmaceutical products
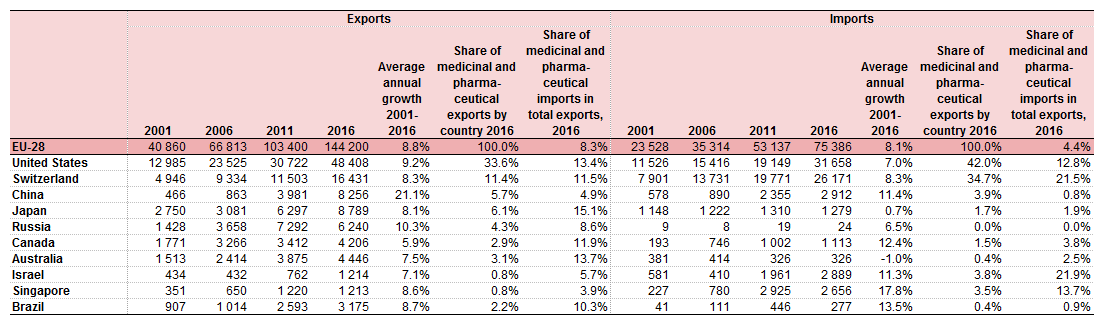
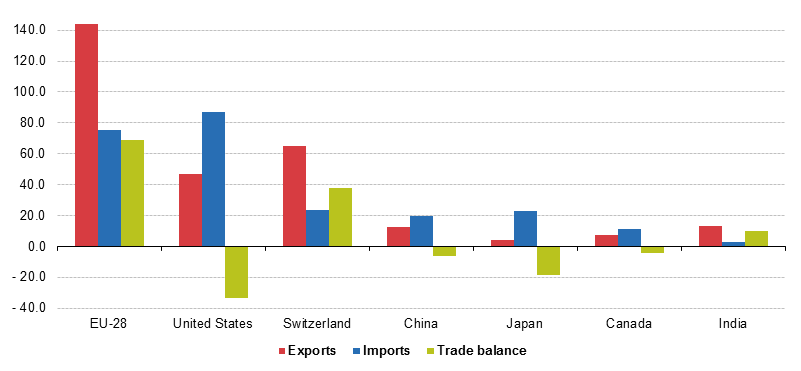
With total exports amounting last year €144 billion, and imports to €75 billion, the European Union was by far the largest world trader in medicinal and pharmaceutical products.
The EU is followed in the top by Switzerland, world’s second largest exporter of pharmaceutical products, which registered in 2016 a total of €65 billion, before the United States (EUR 47 billion).
The United States and Switzerland were the main destinations of EU exports of medicinal and pharmaceutical products, with 34% of all EU exports, and, respectively, 11 per cent. They were followed by China and Japan (both 6%), and Russia (4%).
loading...
World’s leading importers of pharmaceutical products
In terms of imports, the ranking is made up of the same countries, but in a different order. Thus, the United States was the largest importer of medicinal and pharmaceutical products in the world, with a total of €87 billion, followed by the EU, which imported medicinal and pharmaceutical products worthing 75 billion euro, and Switzerland (EUR 23 billion), according to Eurostat, the statistical office of the European Union. Switzerland’s imports (EUR 23.5 billion) were a little higher than those of Japan (EUR 23.0 billion) and China (EUR 19.9 billion).
“Imports of medicinal and pharmaceutical products to the EU were dominated by the United States (42% of all EU imports) and Switzerland (35%). Otherwise, no other country had a share larger than 4% in this area,” Eurostat reports.
EU’s share of trade in medicinal and pharmaceutical products increased sharply
According to Eurostat, since 2002 trade in medicinal and pharmaceutical products has been growing steadily. Thus, with an average annual growth of 7.8%, extra-EU trade almost tripled from EUR 76 billion in 2002 to EUR 220 billion in 2016. On the other hand, on the same period, intra-EU trade more than doubled from EUR 156 billion to EUR 327 billion, equivalent to an average annual growth of 5.4%.
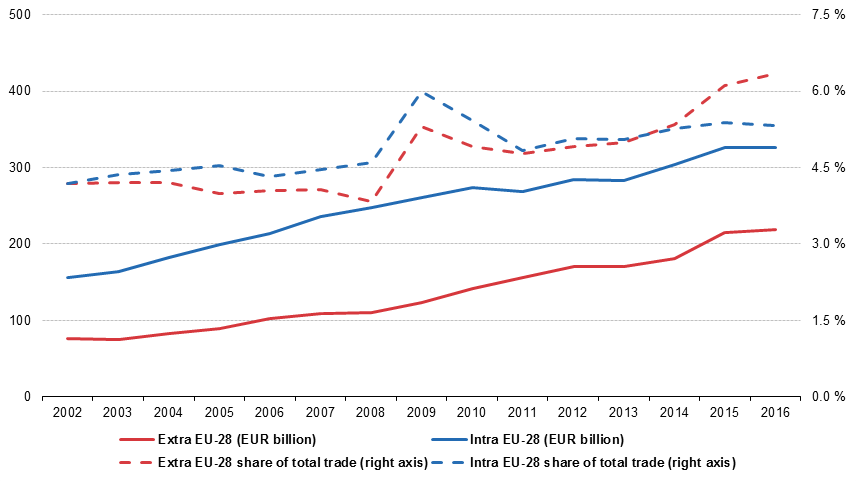
“In 2002, both intra-EU and extra-EU trade in medicinal and pharmaceutical products accounted for 4.2% of total intra-EU and extra-EU trade. These remained fairly close between 2002 and 2014 but started diverging in 2015. In 2016, the share was more than 1% higher in extra-EU trade (6.4%) than in intra-EU trade (5.3%)”, Eurostat reports.
According to the same source, between 2002 and 2016 extra-EU exports and imports in medicinal and pharmaceutical products grew almost every year. Only in 2002 and 2013 imports were dropping slightly. “Even the financial crisis which impacted trade in many other products caused exports to fall by only 0.6% in 2008 while imports even grew that year”.
Due to the fact that exports grew more than imports, the trade balance rose from 22 billion euro in 2002 to a record height of EUR 70 billion in 2015, but in 2016 it fell slightly up to 69 billion euro.
“The United States stands out as the EU’s main trading partner over the period 2001-2016. Both exports and imports more than tripled in this period. The United States share is just over a third of all EU exports which is three times as much as Switzerland which has the second largest share in exports. China (5.7%), Japan (6.1%) and Russia (4.3%) were the only other countries with shares above 4%. Imports to the EU are even more dominated by the United States (42.0%) and Switzerland (34.7%) with no other country having a share of more than 4%”, according to Eurostat.
loading...
Despite their position in the ranking, Switzerland and the United States weren’t the countries with the highest growth rates. Thus, higher growth than the United States (9.2%) for exports had China (21%) and Russia (10%) , while in imports double-digit growth was found in Singapore (17.8%), Brazil (13.5%), Canada (12.4%), China (11.4%) and Israel (11.3%). Switzerland and the United States grew less strongly, with 8.3% and, respectively, 7 per cent.
Which are the largest exporters of medicinal and pharmaceutical products in the EU
Germany accounted the highest share of all extra-EU exports in 2016, accounting for a quarter of all extra-EU exports. Double-digit growth for this segment was also recorded in Belgium (13%), the United Kingdom (11%), France and Ireland (each 10%). On the other hand, the highest growth rates in exports were recorded by Malta, with an advantage of 45%, and Romania, with an increase of 26%.
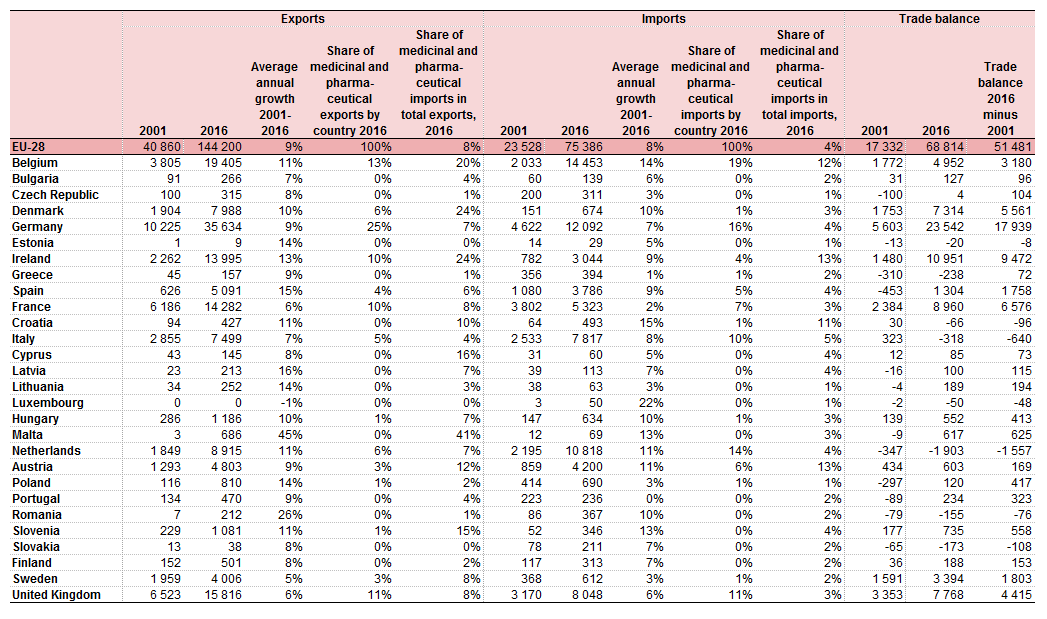
Of the largest five exporters, three are also found among the top 5 importers. These are Belgium (19%), Germany (16%) and the United Kingdom (11%). The Netherlands (14%) and Italy (10%) are also other large importers. The highest rise of imports – 22% – was registered in Luxembourg, while a group of ten countries had growth rates between 10% and 20%.
Which are the main pharma companies by sales
In the EU, the top players in the pharma industry last year were Sanofi, the Paris-based company with $33.8 bln sales in 2016, GlaxoSmithKline, the British company which registered a turnover of £27.9bn (approximately 32 bln euro), AstraZeneca, the London-based company with a total revenue of $23 bln, Bayer, the German producer with almost $17 bln sales according to Pharm Exec‘s latest annual listing of the top biopharma players, and Novo Nordisk, the Danish company which reported approximately 15 bln euro sales.
US’ top pharmaceutical companies are Pfizer, the biggest company in the world, with almost $53 bln revenues in 2016, Merck&Co, which reported $39.8 billion worldwide sales, and Johnson&Johnson, whose worldwide pharmaceutical sales reached $33.5 billion for the full-year 2016.
In Switzerland, the main pharma companies by their revenues were, in 2016, Novartis, which had $48.5 billion net sales, Roche, whose pharmaceuticals division registered last year approximately $40 bln sales, and Actelion, whose sales rose 15% up to approximately $2.5 bln.
Loading...